Inflation is the driving force in the Fed’s playbook and the latest data showed a continued surge in prices to a fresh 40 year high. The good news is that odds are good that we see peak inflation by March. The bad news is that this peak is very high and few have a good handle on what happens thereafter. This uncertainty is a key source of volatility in global markets. With that in mind, it is worth exploring how central banks distill this hodgepodge of data on growth, output gaps, and inflation to shape their view whether accommodation is too tight, too loose, or just about right.
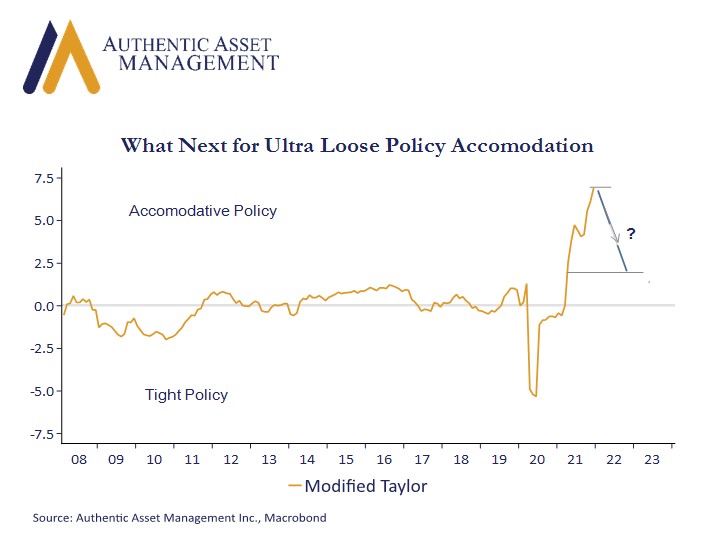
First the chart you see is based on the Taylor Rule. It provides a glimpse of where policy is relative to an idealized goal of price stability in the context of a long-term neutral interest rate relative to the interplay of core inflation and economic output. The Fed uses this as a guide, not a rule per se. There are also many variations around these basic inputs, but what they all show is a chart very similar to the one you see here.
It shows where policy should be relative to where they are. We can see just how tight policy was at the onset of the Covid shock given what was happening to growth and inflation. It drove what was a heroic and swift policy response. In the context of current growth and inflation, it also shows policy rates should be about 7% higher than they are today.
So now let’s plug and play. What would a marked deceleration in inflation do this graph? Let’s assume peak inflation is followed by much lower monthly gains in core prices that brings us from 5.5% y/y today to 2.7% y/y in December 2022. To get there we would average a gain of only 0.2% a month from here which is a fraction of the monthly gain (0.56%) we had in 2021. Over this time, we can factor in 1% in rate hikes by the Fed. In this scenario, we are left with a level of rates that would still be approximately 2% below what they should be.
That is a great start, but nothing more. It is also worth emphasize that this modified Taylor rule used here lowered the 2% neutral funds rate to 0% which effectively reduced 200bps of prescribed tightening relative to the original version. I also ignored above trend economic growth that would also be pushing the expected tightening path higher. It is, therefore, showing the best of all possible outcomes, not the probable one.
The point here is that moving past peak inflation does not mean the Fed can relax. A more realistic outcome is that inflation is around 4.0% by year end, but if we simply average 0.4% a month the rest of the year (still well below the 2021 average) y/y inflation could well remain above 5%. In that case the Fed has a big problem. Based on the rule described here, we know what that would mean for interest rates, volatility, and risk assets.
#AuthenticAsset#portfoliomanagement#investment
For more Insights by Authentic, please visit: https://authenticasset.com/insights/