

The past decade – It is worth a quick look at just how stock markets have been performing. Looking at the decade to the end of March 2016 is likely as good as any, since it captures the peaks in 2007 and 2015, and the trough in 2009.
This chart shows the return, risk, and risk-adjusted return for four stock indices over the past decade on an annualized basis. The Global Broad Market Index (BMI) spans the globe with close to 12,000 stocks. By splitting it into two, we show performance of stocks of Developed countries and those in Emerging markets too. We also include the S&P/TSX Composite of Canadian companies. It is measured in Canadian dollars while the others are valued in US dollars. For a more like-for-like comparison, subtract about 1% from the annualized S&P/TSX return, since the Canadian dollar fell by about 10% over the decade.
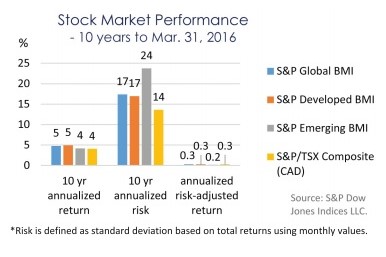
Even in hindsight this chart is stunning. To sum up stock market performance over the past decade to Mar. 31, 2016:
• Low returns – Just 3 to 5% per year, without much variation across developed and emerging markets, with Canadian stocks at the lower end once currency adjusted. Not shown are similar returns in Pan-Asian and European markets of about 3%, and a notably higher 7% return on the S&P 500.
• High risk – Stock markets have been gyrating by 14 to 24% per year on average. Interestingly, phases of higher volatility do not necessarily coincide with extreme fundamental stock market valuations.
• Meagre risk-adjusted returns – Divide the returns by the risk levels to work out the risk-adjusted returns. They are in the range of 0.2 to 0.3. These returns look even thinner when one brings the eroding effects of inflation into the picture. Canadian inflation has risen by about 1.5% per year over the past decade.
The decade ahead – Of course, foresight may surprise even more than hindsight. There are arguments to expect stock market performance over the coming decade to be even less rosy than the decade just past:
• Tepid “top line” growth – In aggregate, revenue growth is a function of the pace of global economic expansion. It is likely to be slower over the coming ten years than the past decade. Poignantly, consumption growth is likely to be stunted by the demographics of aging populations in major economies, and by high levels of indebtedness which serves as a drag on future potential demand.
• Squeezed profit margins – Global competition has become intense. Leading companies are increasingly advanced in developing and managing global supply chains on the one end, and just-in-time delivery systems on the other. They have also chosen to “optimize” their cost structures in recent years by mitigating the cost and amount of labour utilization, and cutting back on long term capital investment. This all but guarantees that “bottom line” corporate earnings won’t be growing much over the coming decade; the primer for future productivity advances is absent.
• More volatility – Low rates of growth and inflation, asynchronous monetary and fiscal policies, and volatile foreign exchange rates, are gunpowder for explosive stock market price action. At low levels of economic activity, the measurement margin of error is a much greater proportion of the whole. Investors will thereby extrapolate false signals of economic trends with greater regularity.
AUTHENTIC’s Perspective
1. “Buy and hold” – This strategy may very well not cover the rate of inflation, and could provide a zero return all-in over the decade ahead. The long term rate of return on such a portfolio will be very highly dependent upon the start and end dates chosen to review performance. One only needs to look at the S&P/TSX Composite over the past year to crystallize that thought. At one point it was down -23%, which equates to over half of the total return ultimately realized over the entire 10 year period. Or putting this into another time frame, the 4% annualized return of the past decade, is no more than the daily variation of the stock market on some days.
2. Traditional balanced portfolio – Adding bonds to the mix may not be much, if any, help. Government bond yields are low, often below the rate of inflation, and negative yields exist across a third of the global marketplace. Corporate bonds may help add yield, but may end up behaving more like stocks in terms of volatility, yet with capped upside potential.
3. International vs. Canadian – We suspect that Canadian stocks will underperform international markets in the coming decade due to the limited and lopsided composition of the Canadian economy. Most of the top 10 companies that comprise about 40% of the stock index enjoy excess profits due to the favoured touch of government. Rights to excessive pricing are granted to banking and telecom-munication services companies, while property rights to materials and transportation companies are underpriced. Canada, like countries before it that are now far more competitive and innovative, must repurpose these government incentives to higher value adding activities, and to industries in areas such as technology and health care.
4. Active management – It makes sense to seek a more attractive risk-return profile when passive stock investments may deviate by as much as 25% on an annualized basis to earn 4% or less. Not that getting it right with active management is easy. Higher return objectives usually necessitate tolerance for even higher volatility. Furthermore, success is not guaranteed. Timing is everything, in markets as in life, and even a balanced coin sometimes lands tails twenty times in a row. With a slight investing edge, perseverance and risk control, good results may emerge as desired over time.